IRIS Central is the education sector’s all-encompassing reporting tool that’s been developed to give trusts speedy access to complete data. Pulling data from numerous sources into a central place, the solution allows you to produce detailed reports that help you to spot trends and anomalies in your trust or MAT’s functions.
From patterns between budgeting and risks, to correlations between staff absences and student behaviour, IRIS Central is here to help you make informed changes to improve the running of your organisation.
Read on to learn how you can use IRIS Central to better understand trends in staff absences!
How does IRIS Central work?
The reporting tool takes information from a multitude of systems you’ll likely have running every single school day and displays it on a set of dashboards. MIS, compliance managers, HR platforms, finance and budgeting programmes – the list of data sources that it integrates with is broad, so you can get your hands on a wide range of insightful reports specific to your needs.
IRIS Central is based on Power BI, meaning it’s completely flexible – you can slice and dice data as you wish! So, you could be looking at teacher absences across all schools within your MAT one minute, and for a particular school the next. Once you’ve decided which datasets you’d like to view and compare, IRIS Central presents it in near real-time on an interactive dashboard.
What sort of patterns does IRIS Central show?
As a rule of thumb, there are certain areas of school life where you’re more likely to find patterns. For instance, more slips, trips, and falls over the winter months than the summer due to the colder, icier weather. A higher number of accidents and incidents tends to correlate with more student or staff absences, more reliance on supply staff, and so forth.
Whilst this ‘general’ knowledge is useful, this is where it tends to stop. But what if there were a particular school site where the majority of slips are happening, leading to higher absence rates?
It’s this bigger picture way of thinking where IRIS Central really starts to build a more detailed picture of the day-to-day running of your academy or MAT. And it’s here where you’ll start to be able to make a positive impact on your staff, students, and visitors.
How to find patterns in staff attendance data
We’re big believers that staff absence management is so much more than simply recording the absence and following the procedures set out in your school’s absence policy. Absence management can be made far more impactful when you start to really look at data stretching further than a ‘reason’ or ‘duration’ checkbox!
With IRIS Central’s customisable dashboards, you can compare staff absence data against other data sources, like pupil absence or pupil behaviour. (That’s because Central integrates with our HR software, Every HR, and your MIS!) Perhaps there was a change to a behaviour policy which led to worse behaviour (as evidenced in behaviour points), and this had a knock on effect on staff absences over a certain period.
Understanding staff attendance with Every HR
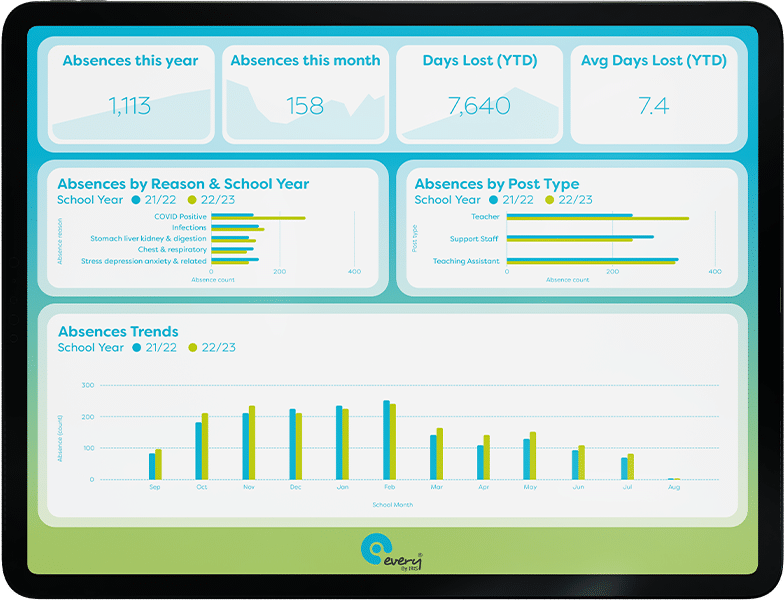
Beginning to see how IRIS Central is empowering managers and leaders to collate data in a more intelligent way? We thought as much! But it doesn’t stop there. Take the example dashboard below, showing staff absence levels. You’ll see that the headline figures are clearly displayed along the top of the report and then broken down underneath. There’s visual charts and graphs to show absences by:
- Reason
- Post type
- School year
Plus, trends over time. You’ll also see that each category shows absence data for more than just that a single time period. Meaning you can compare each absence category against itself, too, to spot any new, continued, or now-obsolete patterns.

Using IRIS Central to improve attendance
So how does that actually help you? Well, you could then look to feed in student absence data to see if there’s any patterns or anomalies:
- Are the trends over time generally similar? Perhaps there was a particularly nasty flu outbreak during the winter term which explains the spike in both staff and student absences.
- How do levels of student absence line up with school type? Are absences higher, lower, or the same for primary and secondary schools in your trust?
- How could this insight help you build a better picture of what’s going on within your school?
The types of trends that are rather fascinating are the ones you’re not expecting. For instance, better levels of a class’s behaviour when their usual teacher is absent. The teacher might be struggling to form a connection with the class, prompting the students to act out of line which causes the teacher stress. When you’re able to marry the two elements together, you’re more informed about what’s really going on.
And it gives you the opportunity to proactively intervene! That could be having an open conversation with the teacher to work out if they need any additional support in the classroom. Or, speaking with the students to better understand what’s causing the disconnect between them and the teacher. You can then put informed measures in place to improve the environment for both the teacher and the class.
There’s so much more that can be gained from these next-level reports – we’re only scratching the surface, here!
If you’d like to find out what IRIS Central could do for your reporting, our team are just a call or email away.


